
Terrabase
Product design / Enterprise AIAI analytics.
Built to be questioned.
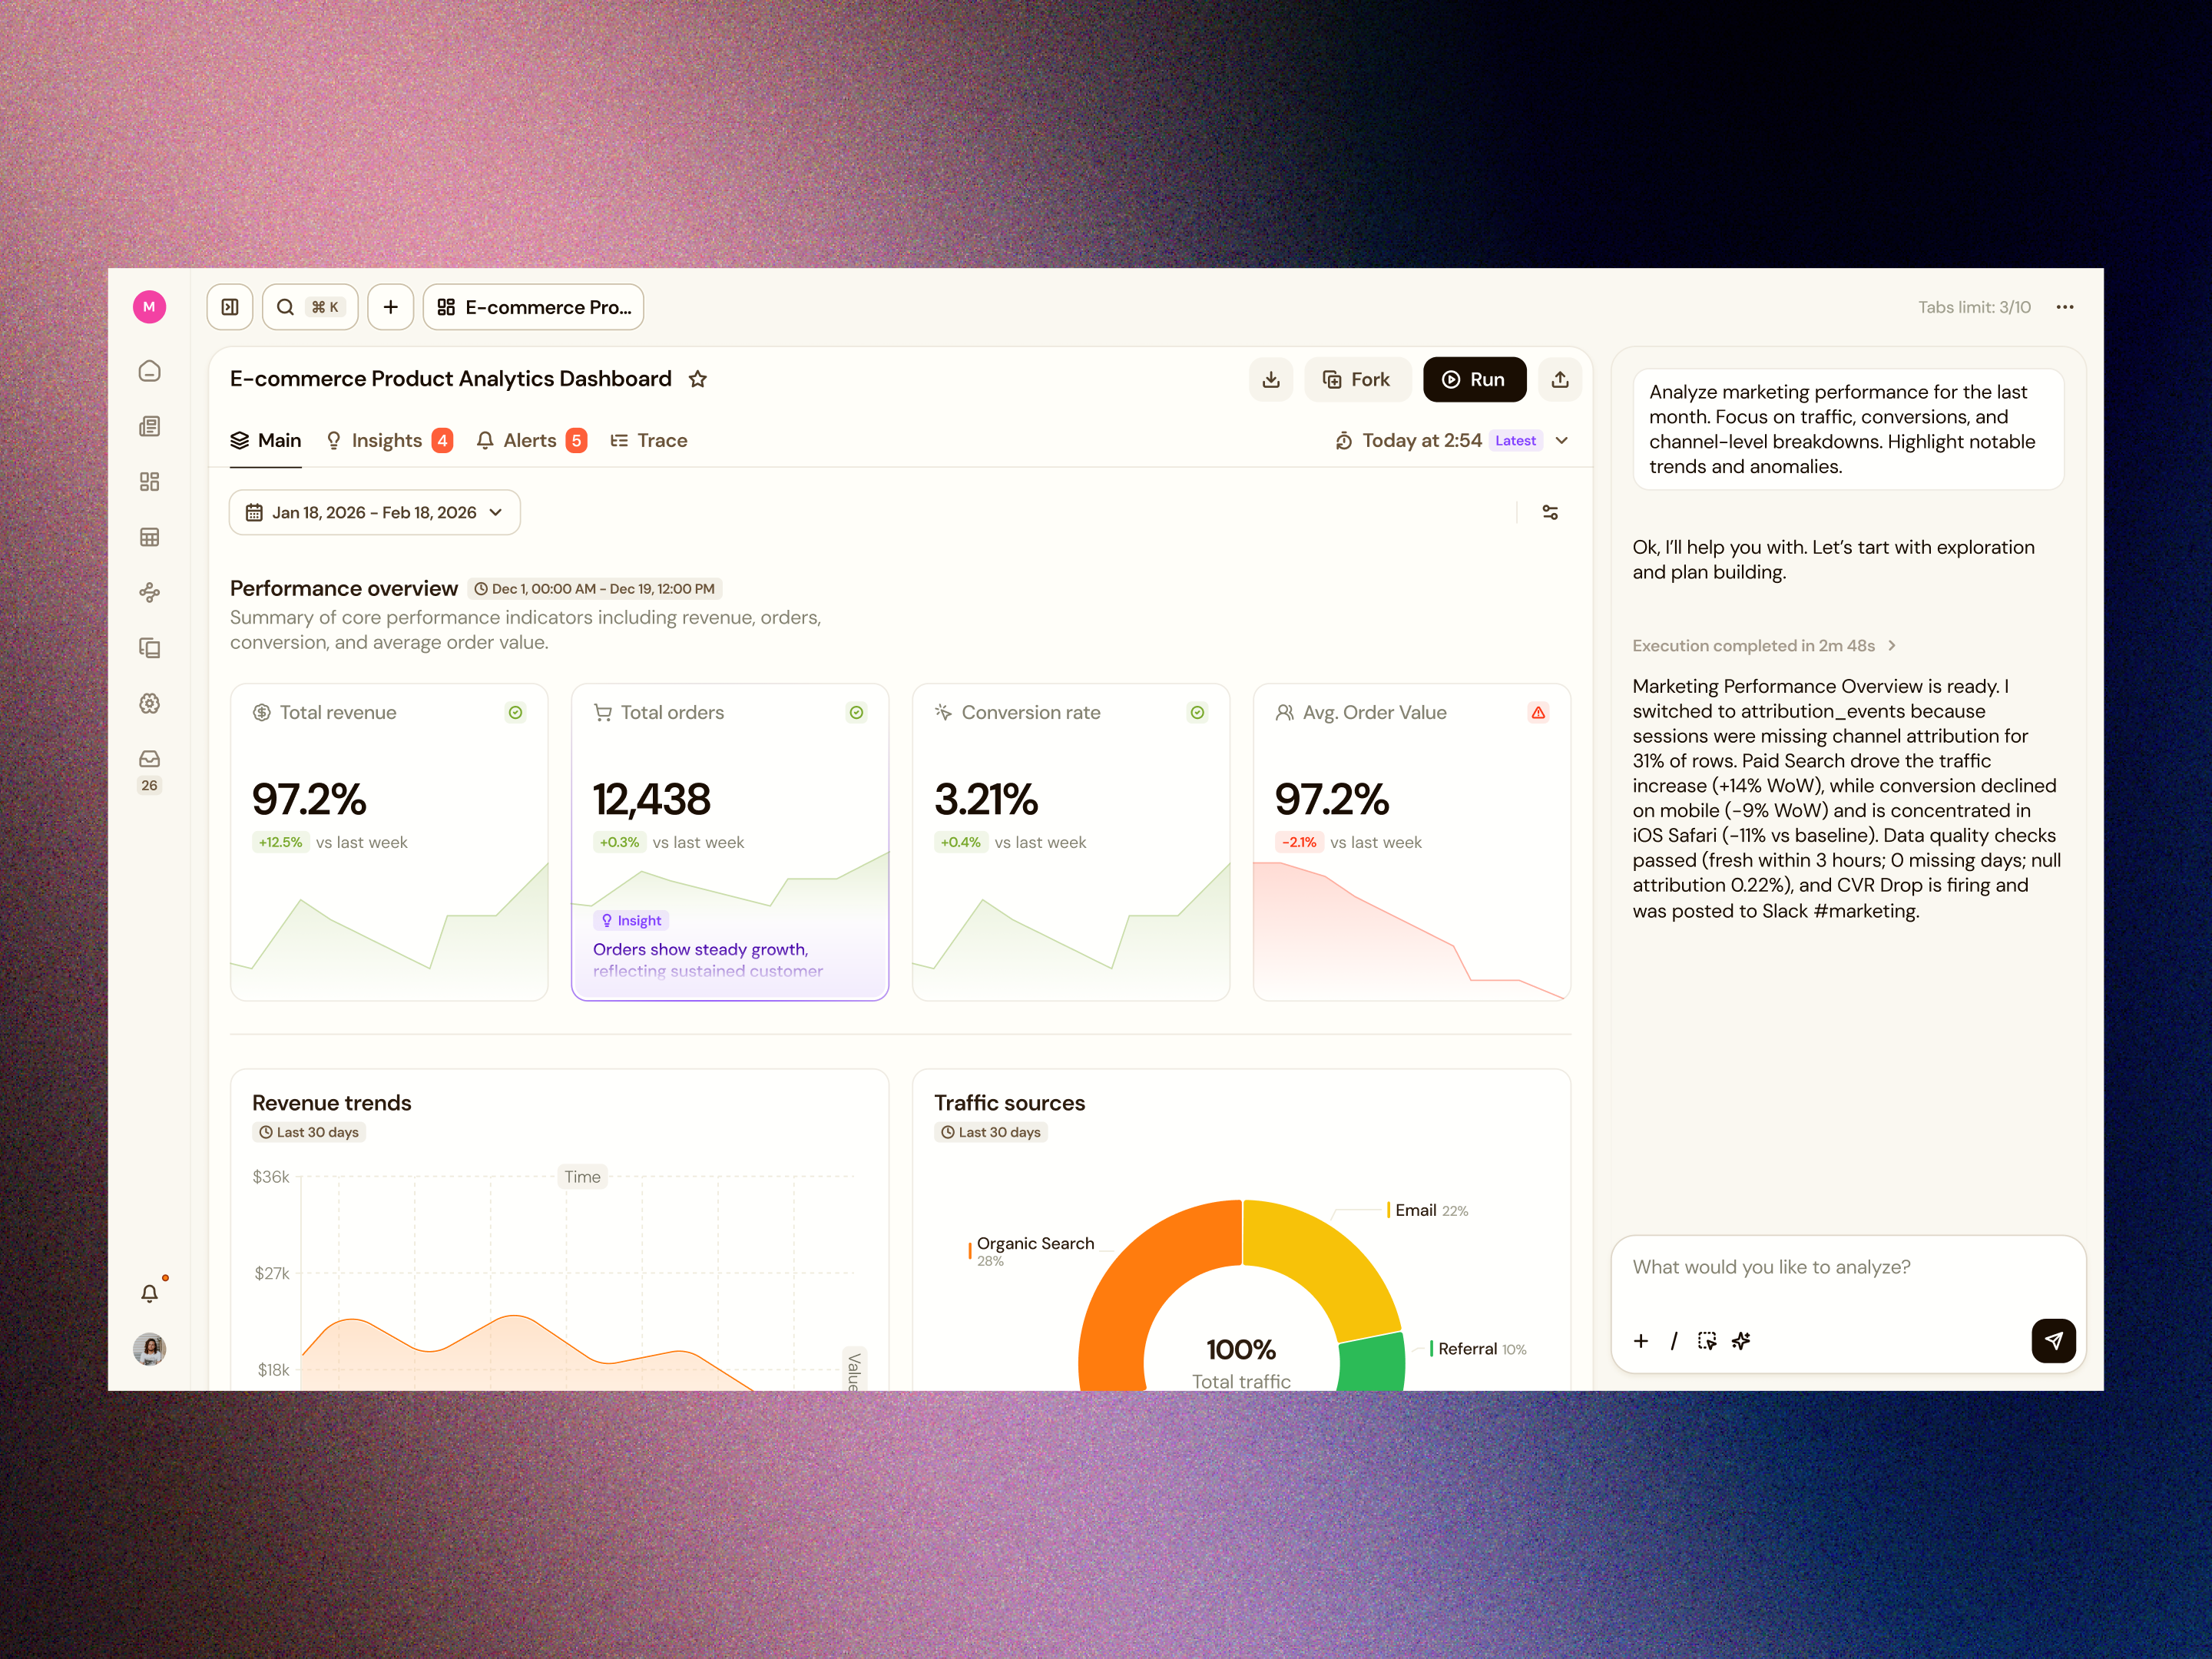
We designed an analytics workspace where teams can ask a business question, shape the analysis, and inspect the result. Our challenge was to make a powerful AI workflow understandable at every step, from the first prompt to the next automated run.
- Product
- AI analytics & automation
- Built for
- Enterprise data & operations teams
- Explore
- Visit Terrabase ↗
The design challenge
A useful answer needs
a way to question it.
A polished dashboard can hide difficult questions. Which sources did it use? What does a metric mean? What happens when the data changes? For an enterprise team, generating an answer is only the beginning of the work.
We built the experience around three moments: agreeing on what to produce, examining what came back, and deciding what should happen next. Reports, dashboards, and sheets share that structure, so users can move between formats without learning a different way to work with AI.
01 / Start with a real question
Make the first useful result
part of getting started.
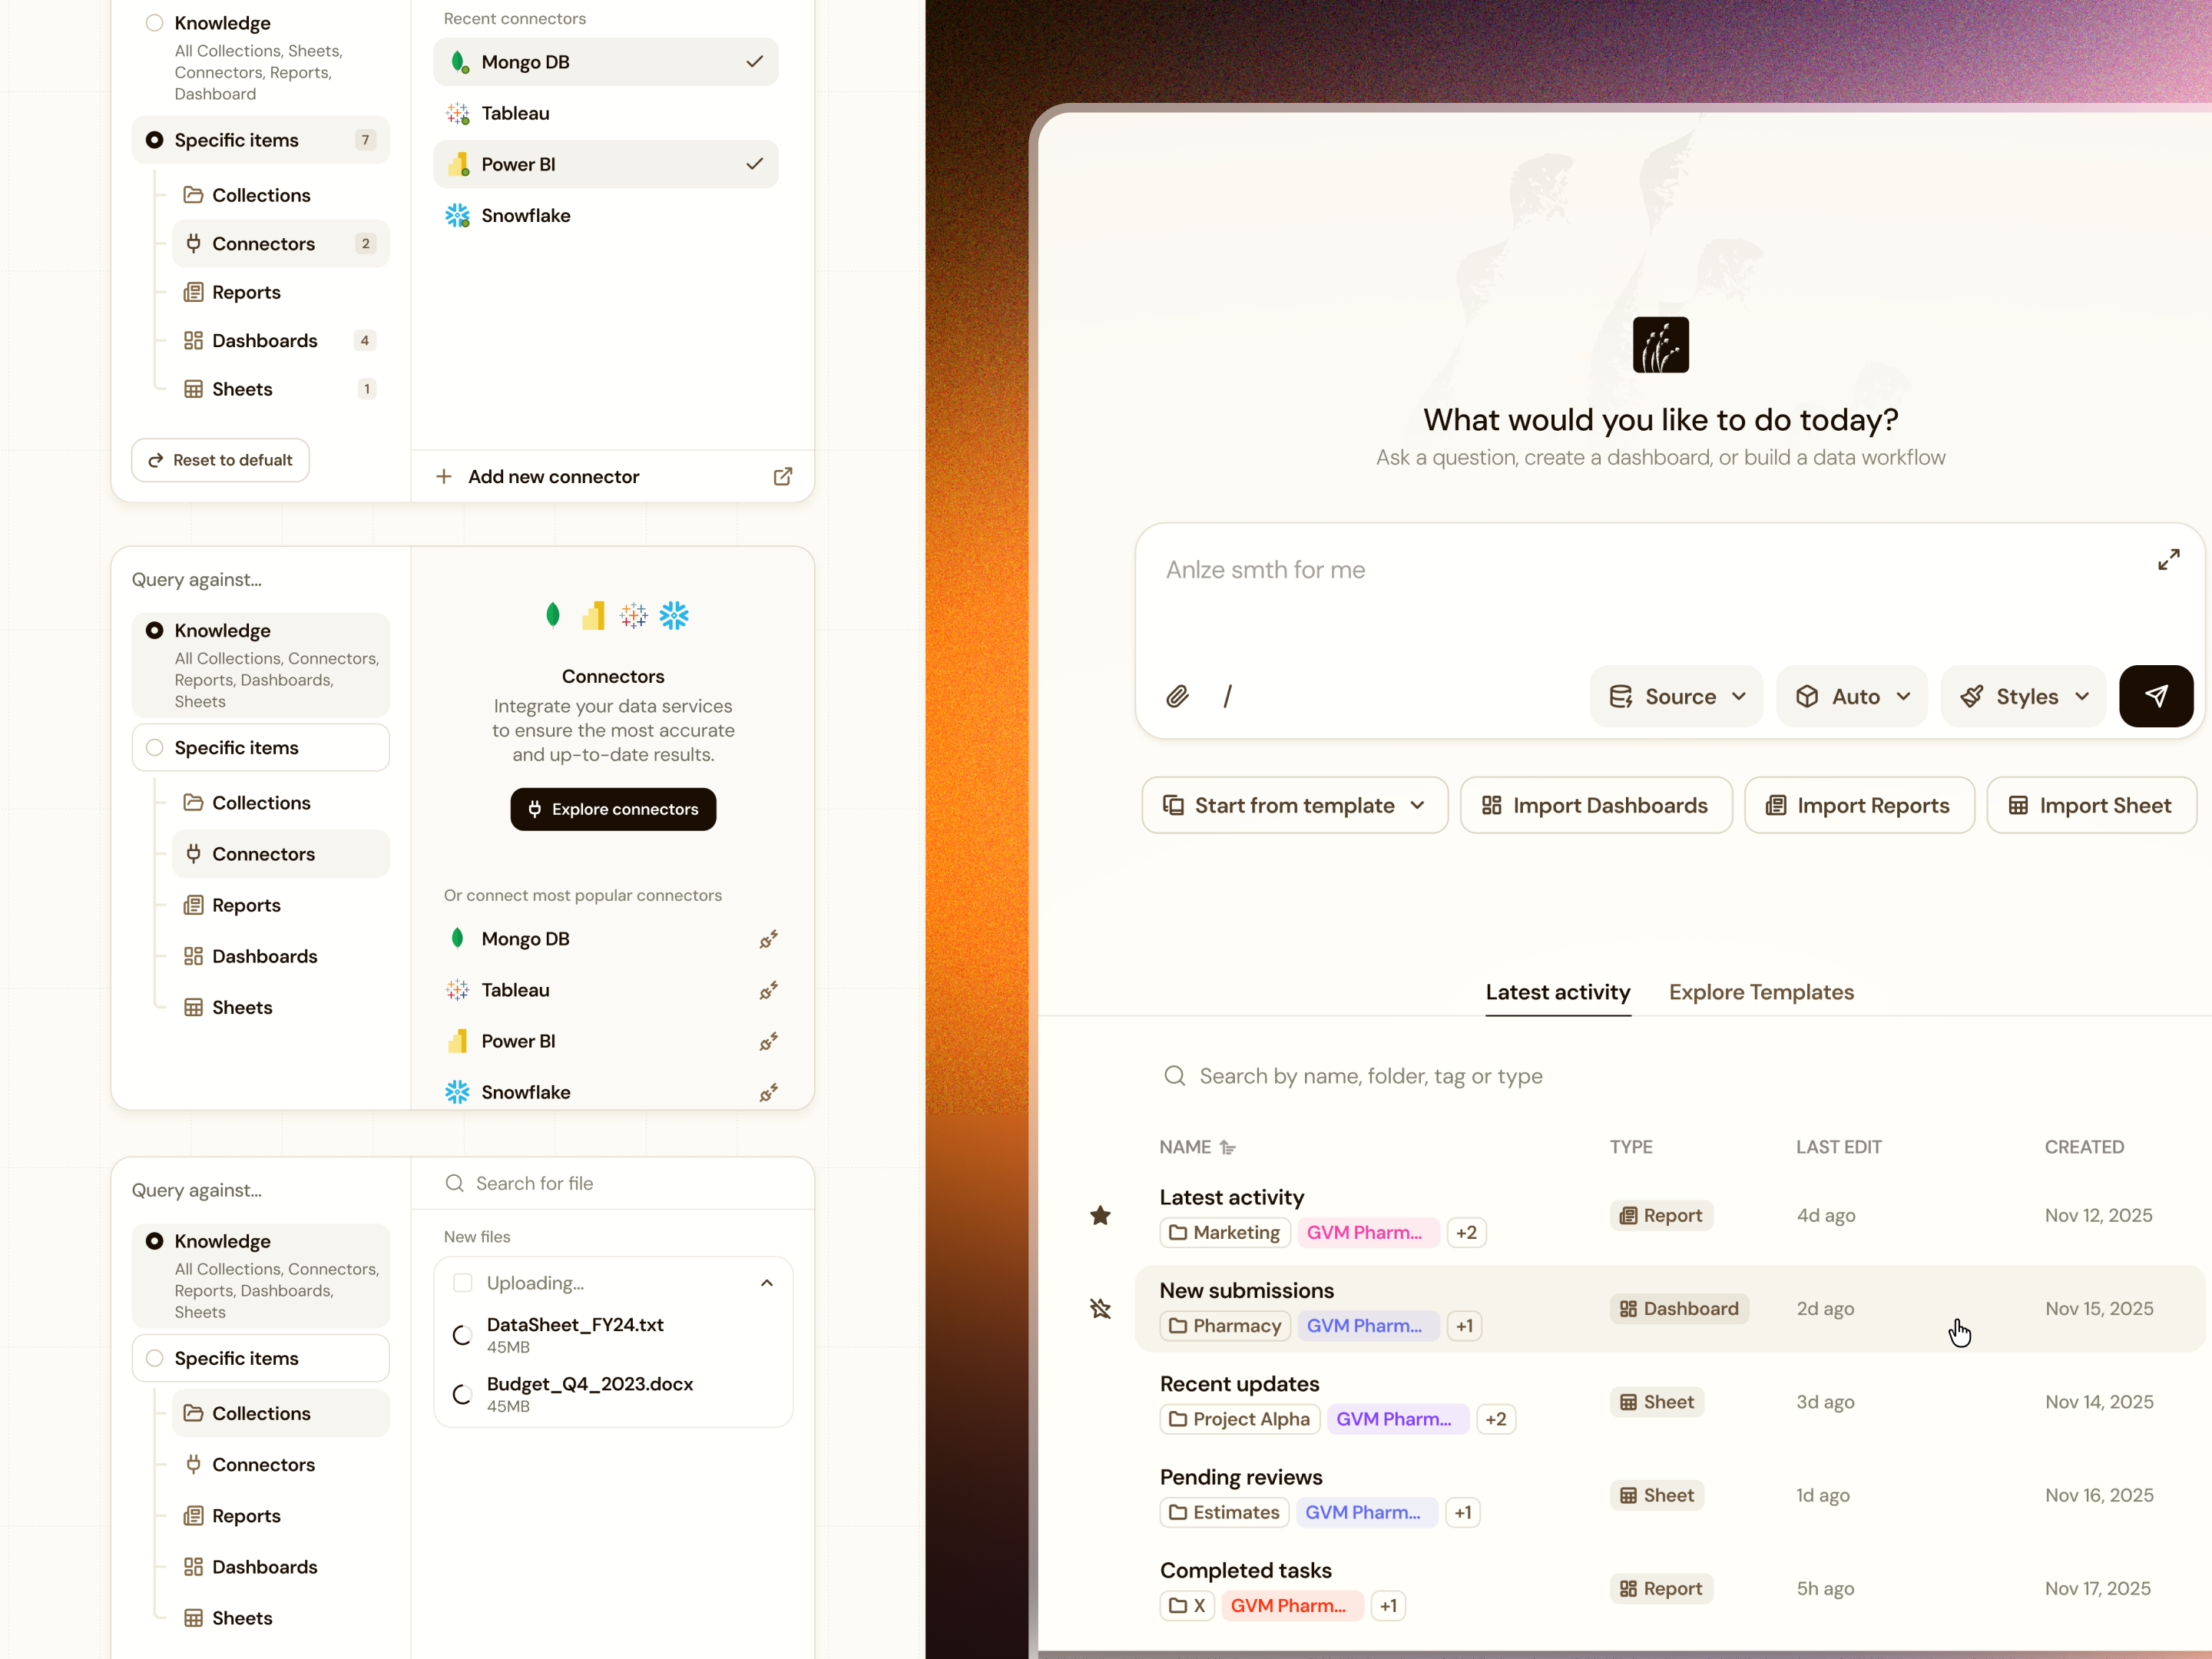
We brought the core workflow into onboarding: choose what to build, describe the question, and connect a source or upload a file. Generation can begin while the user finishes setting up their profile and team. The same controls carry into the home workspace. Automatic source and output selection offer a starting point; explicit selectors let an analyst narrow the data and choose the format. Teams can begin with a question and add precision as they go.
02 / Agree on the work before it runs
Put a checkpoint
before the expensive work.
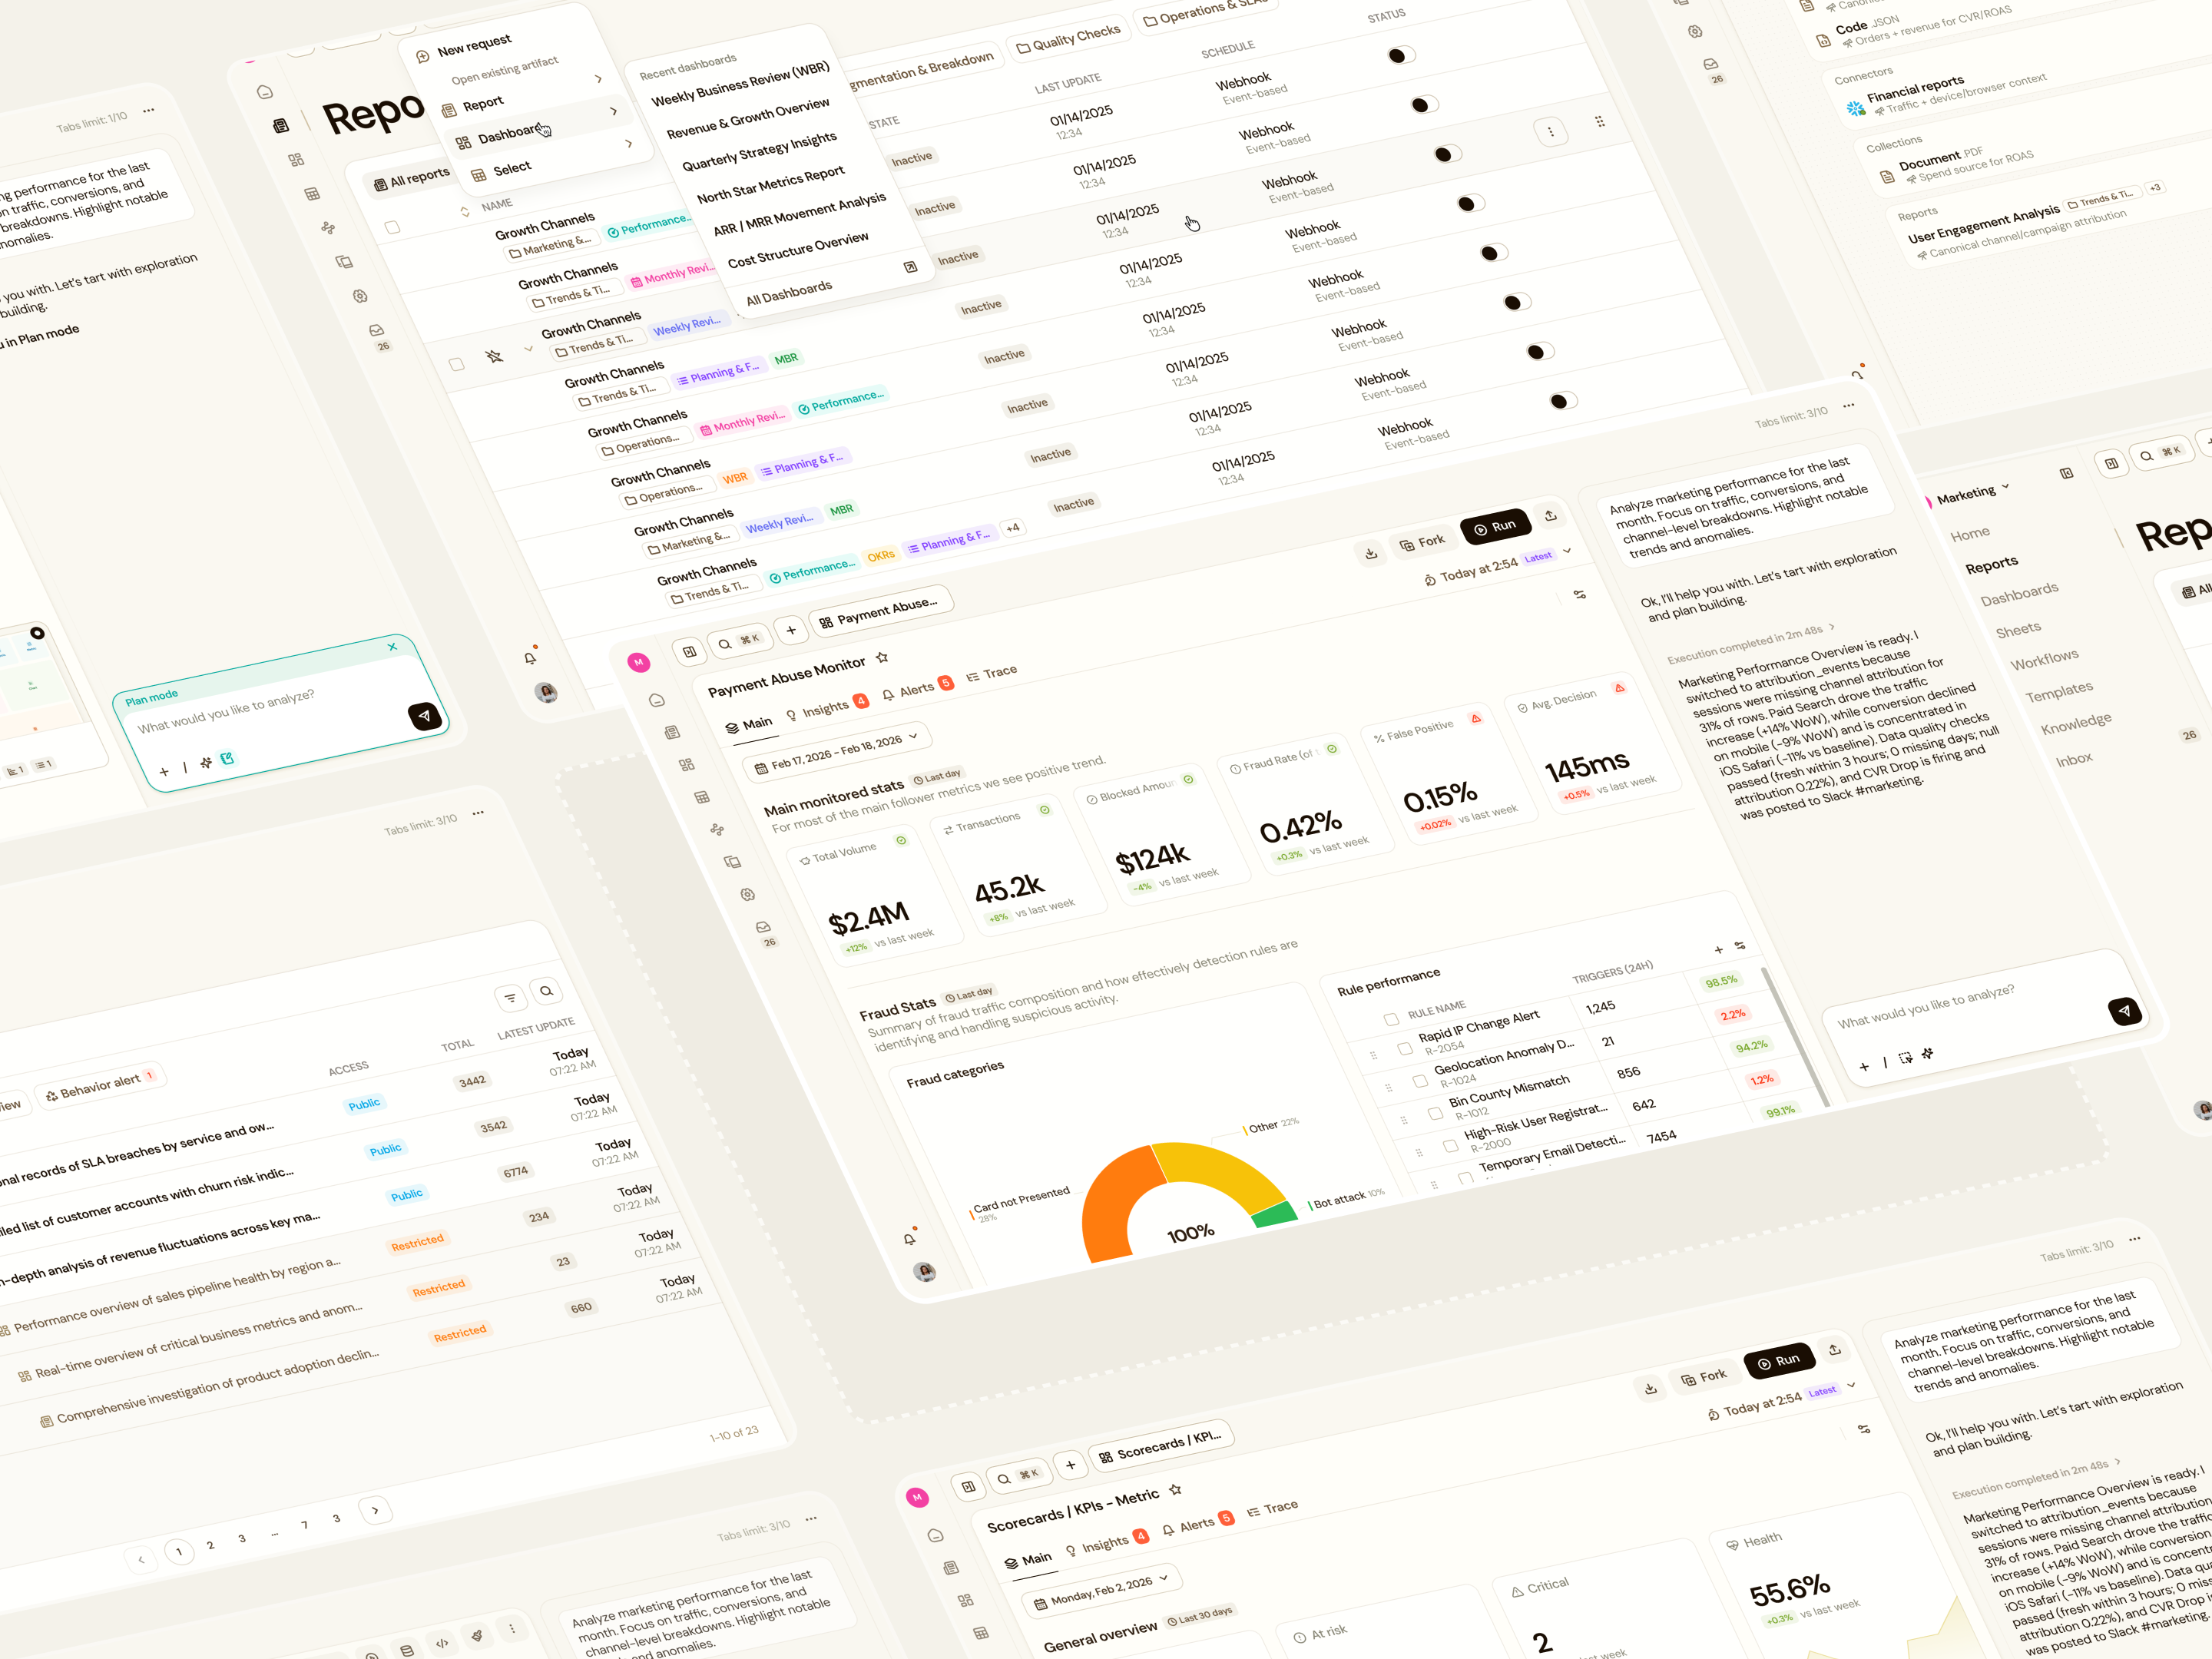
Complex requests need a shared definition of success. We designed Planning Mode around four editable parts: the outcome, presentation, data sources, and success criteria. Users can revise the plan directly or through chat, then approve it before execution. Simple requests can move straight through. Once work starts, expandable stages show progress and the files involved; a distinct waiting state makes it clear when the system needs an answer. The approved plan remains available for reference.
03 / Make the scope of an edit visible
Point to the thing
you want to change.
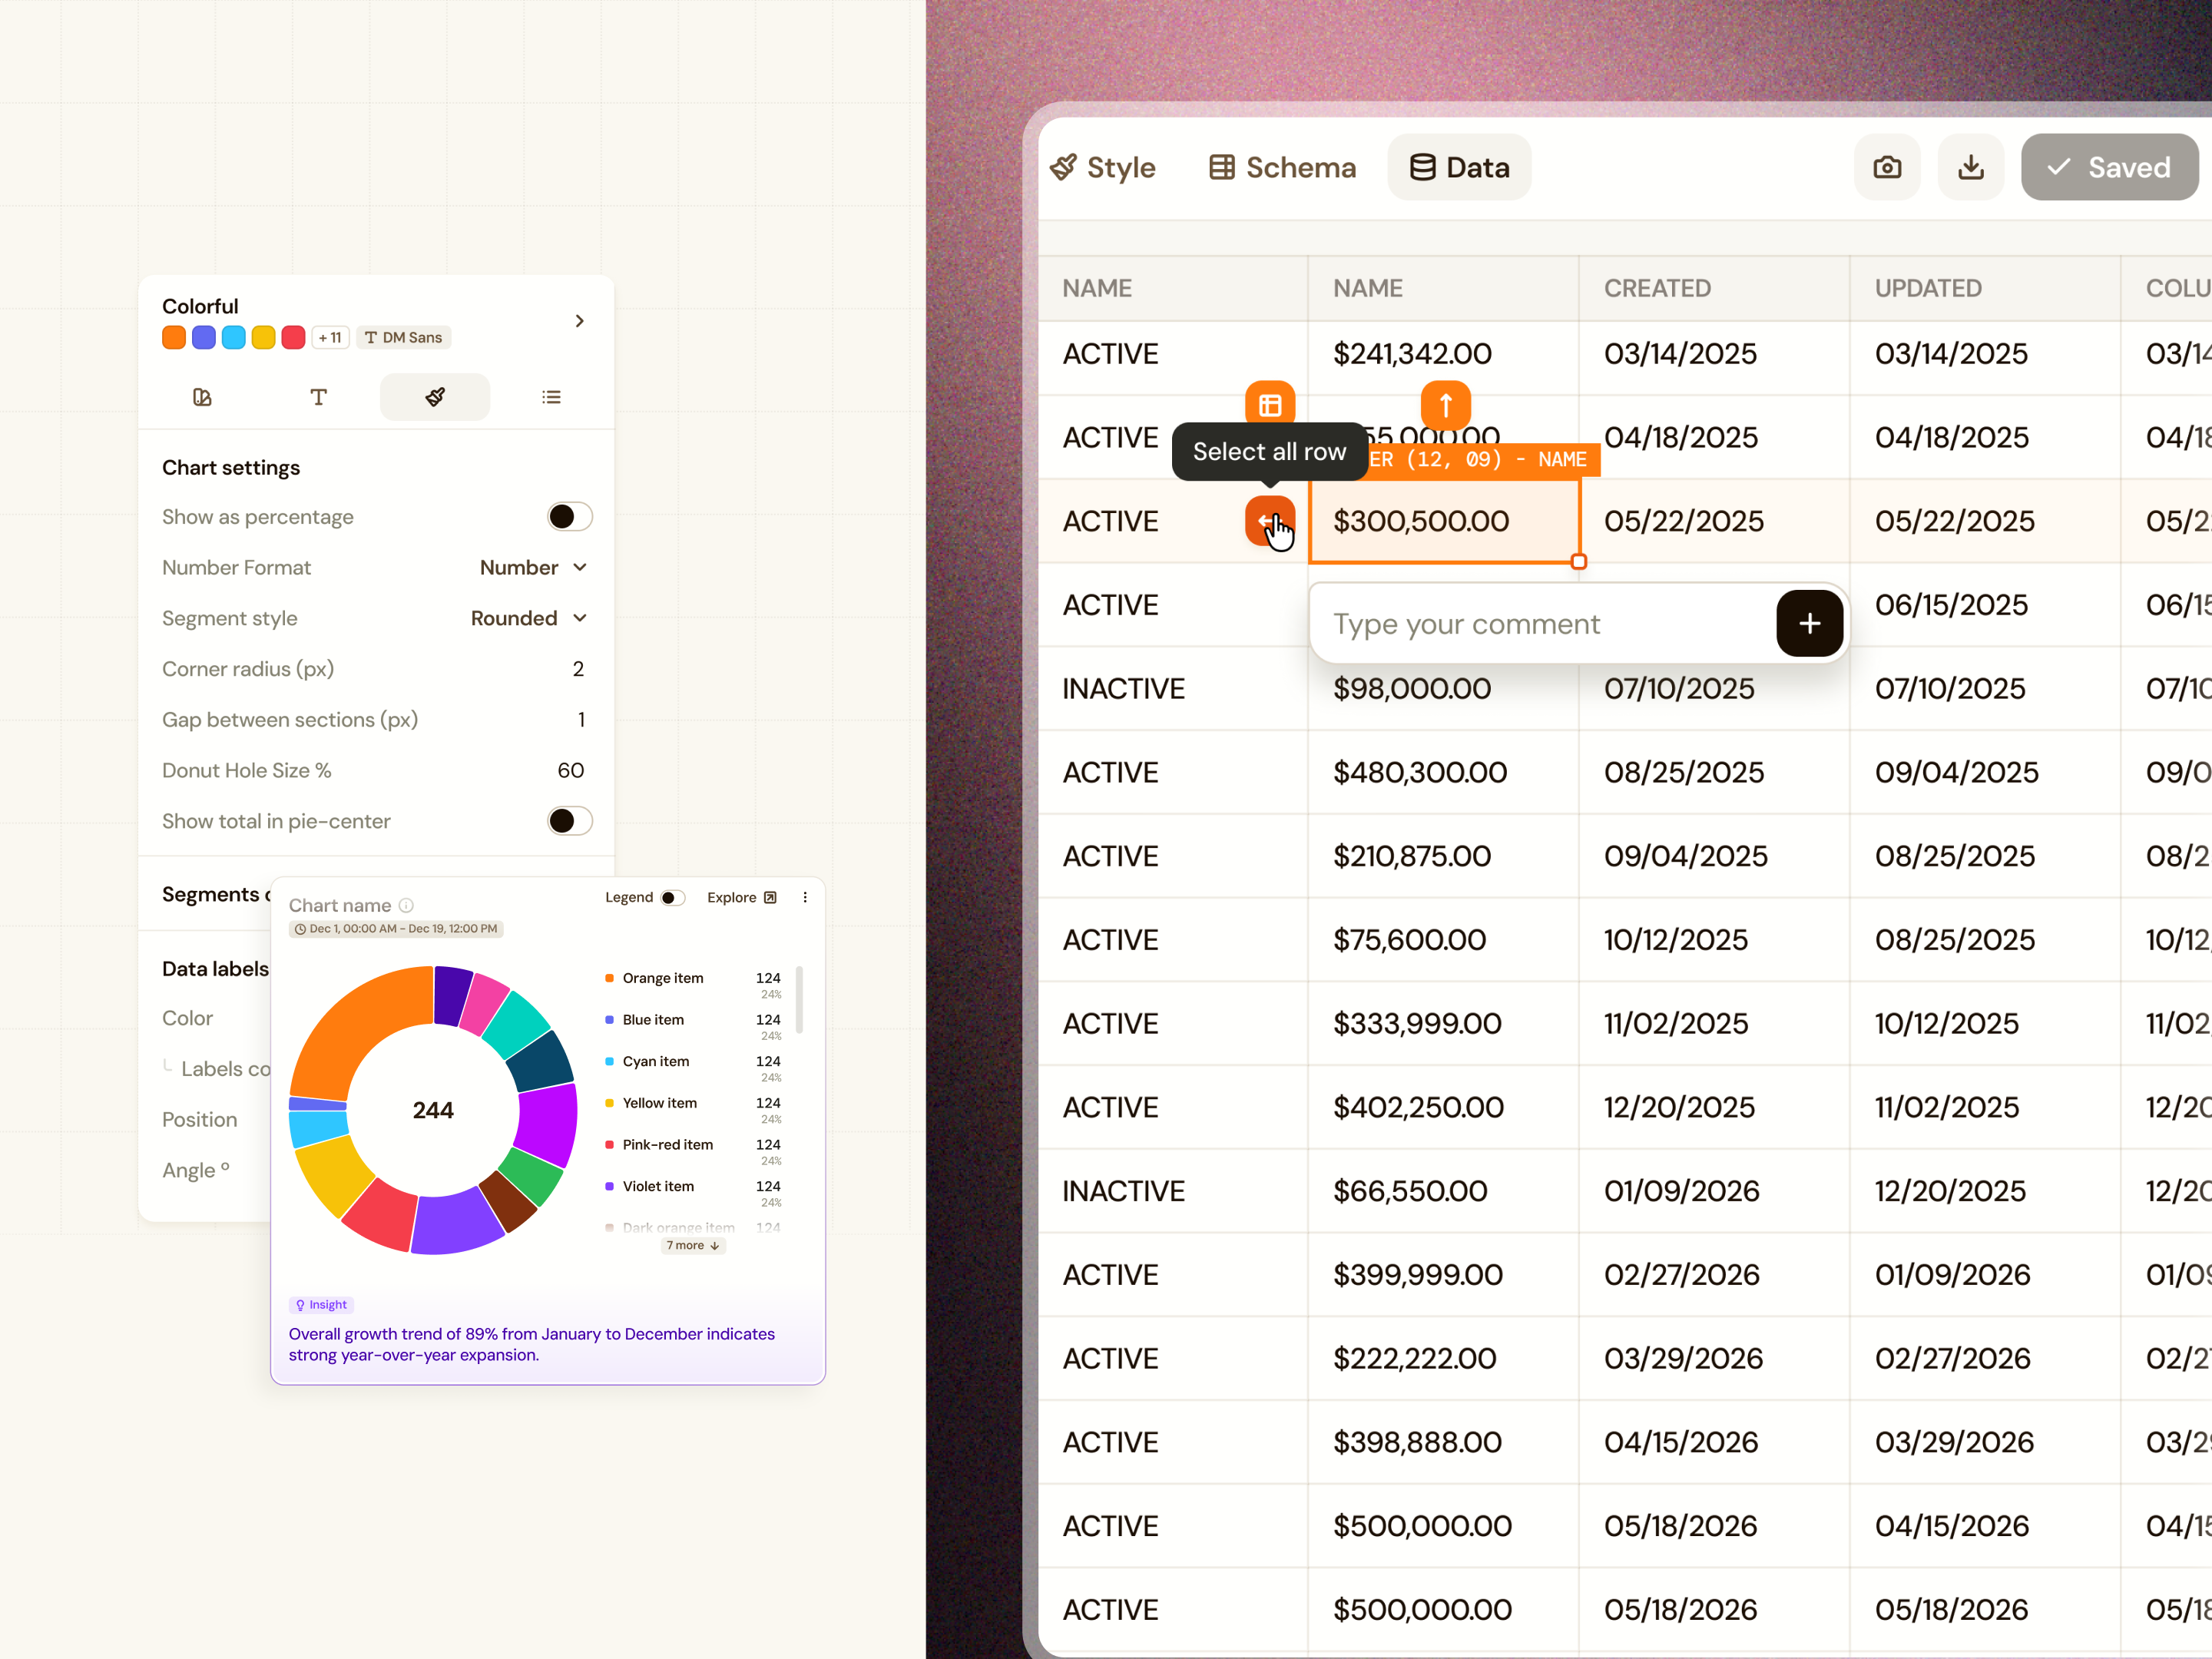
“Fix this chart” is ambiguous when a dashboard contains dozens of elements. We made selection part of the conversation: choose a chart, a row, or a cell, then ask for a change in that context. Explore brings the visual, styling, schema, and underlying data into dedicated views. Comments can be collected into one request. Local style adjustments stay separate from shared themes, so refining one chart does not accidentally restyle the rest of the workspace.
04 / Keep the answer inspectable
Every result needs
a route back to its inputs.
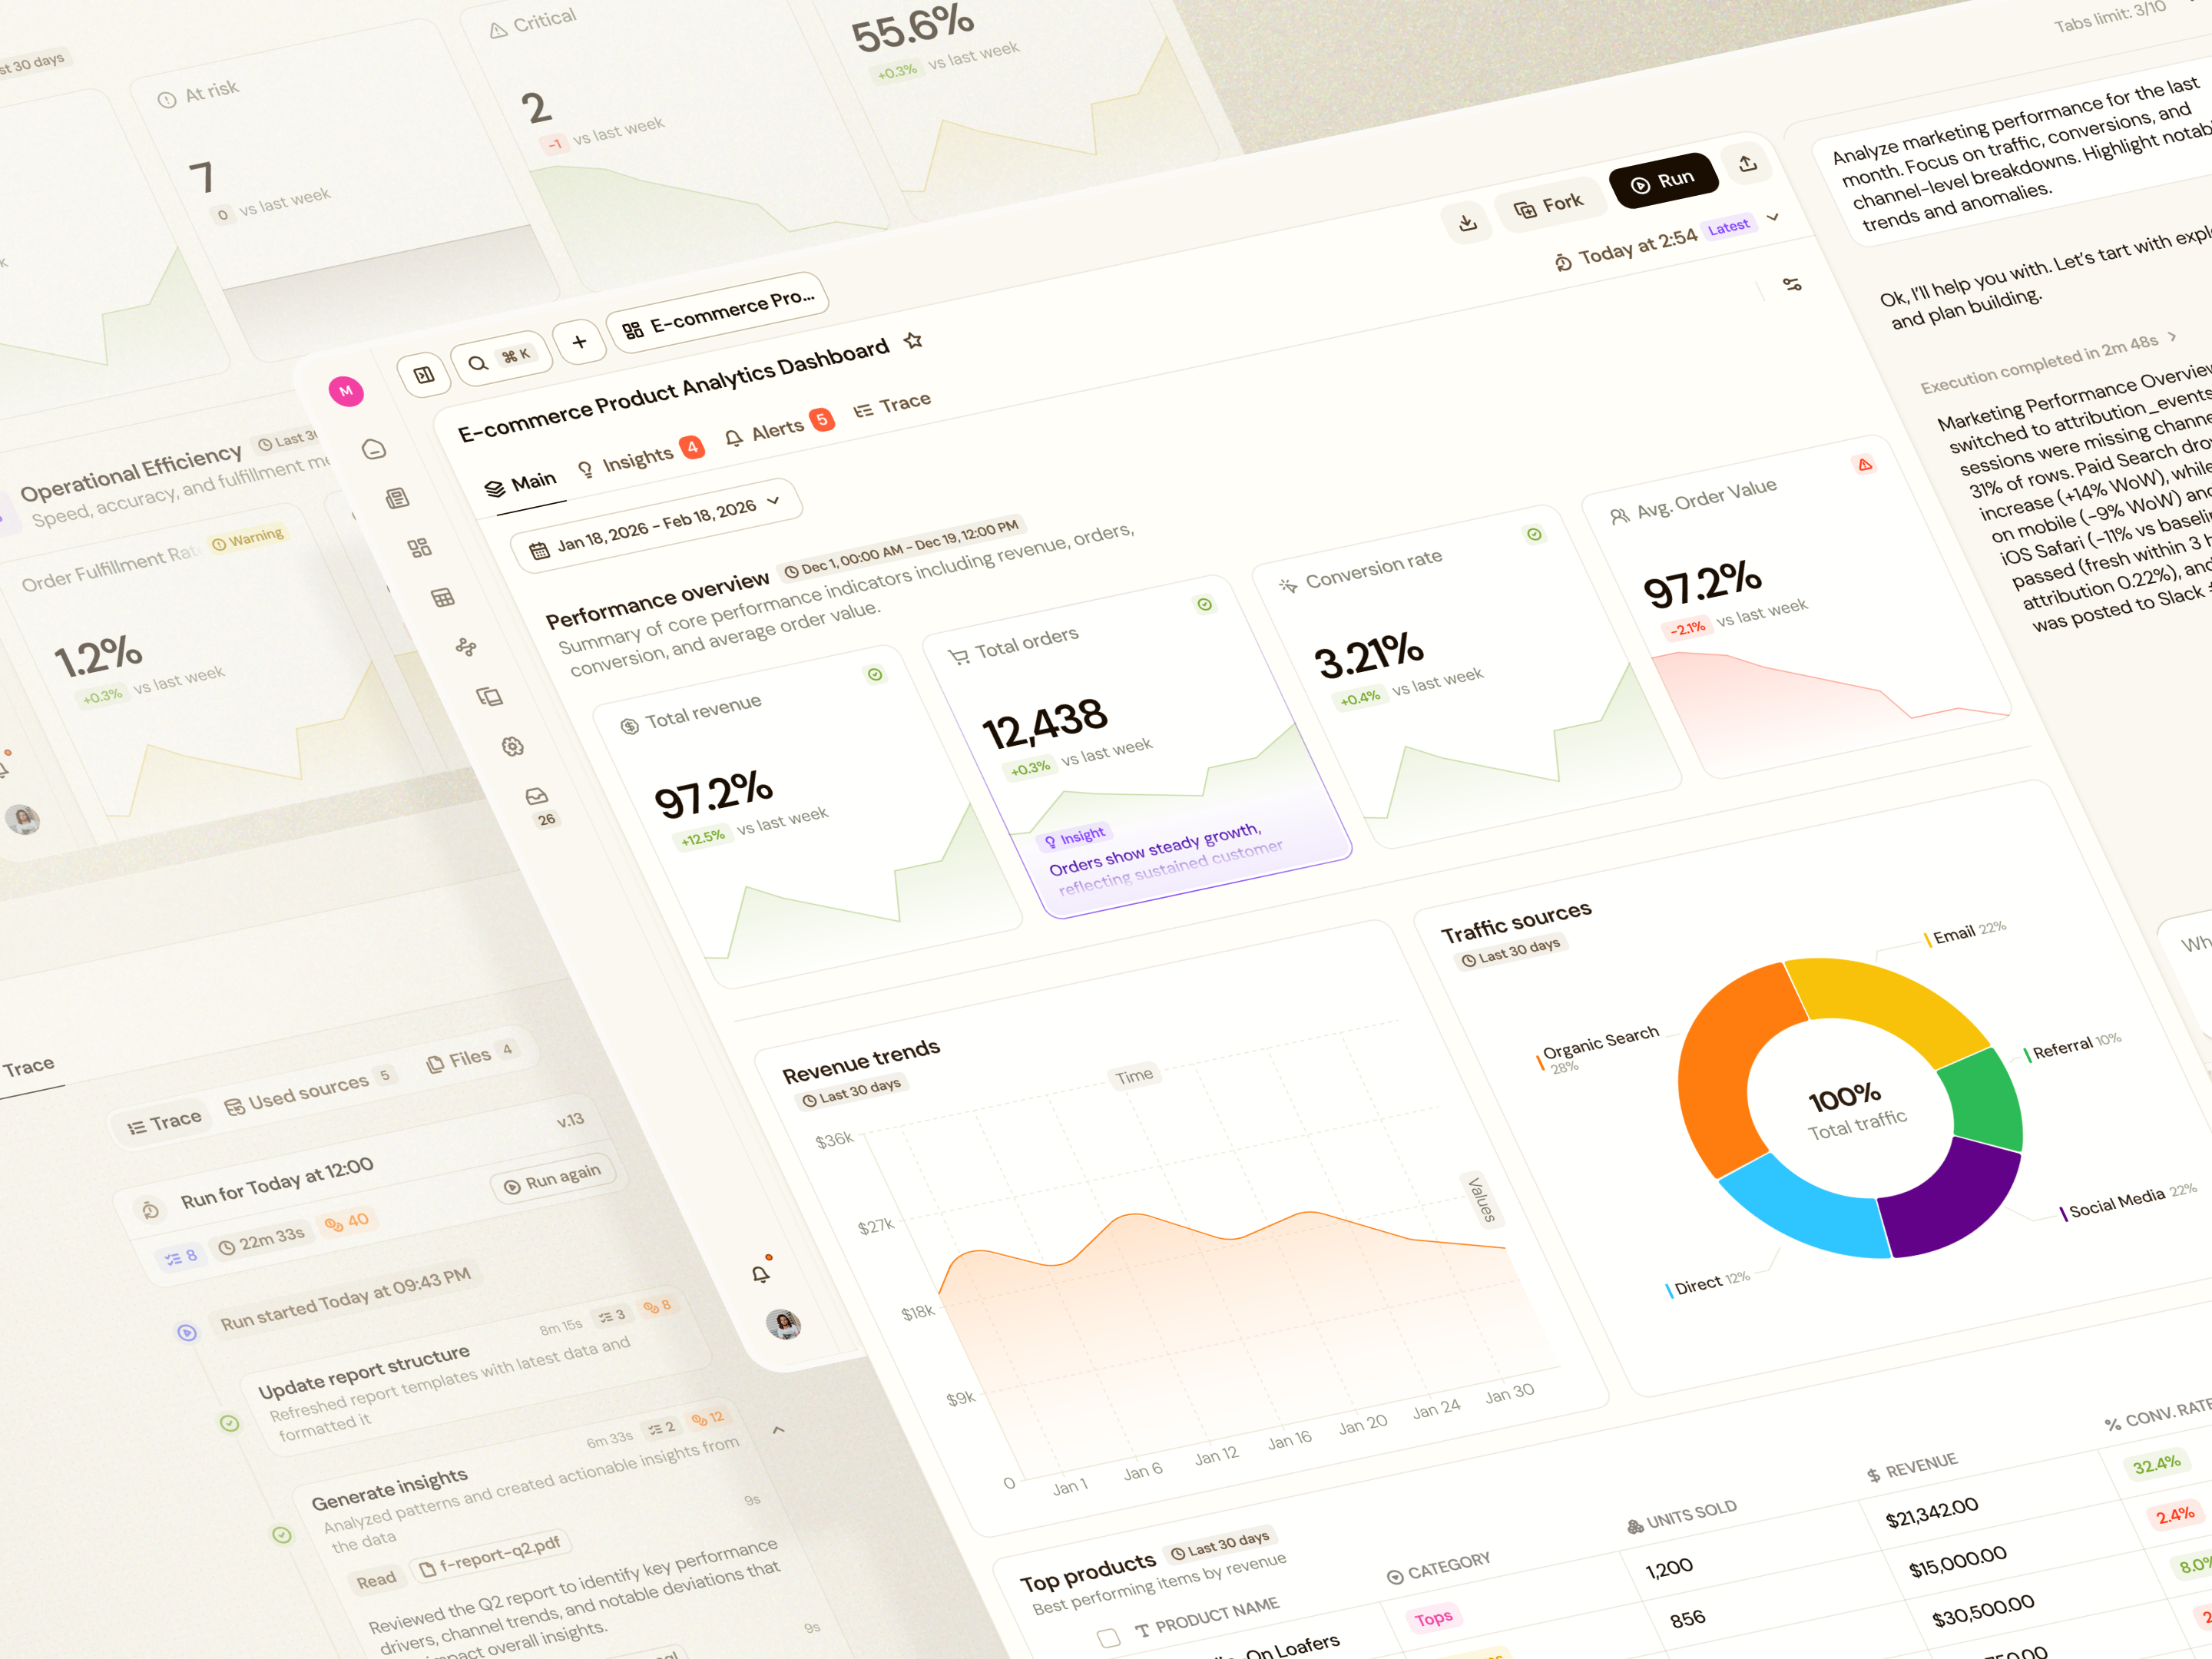
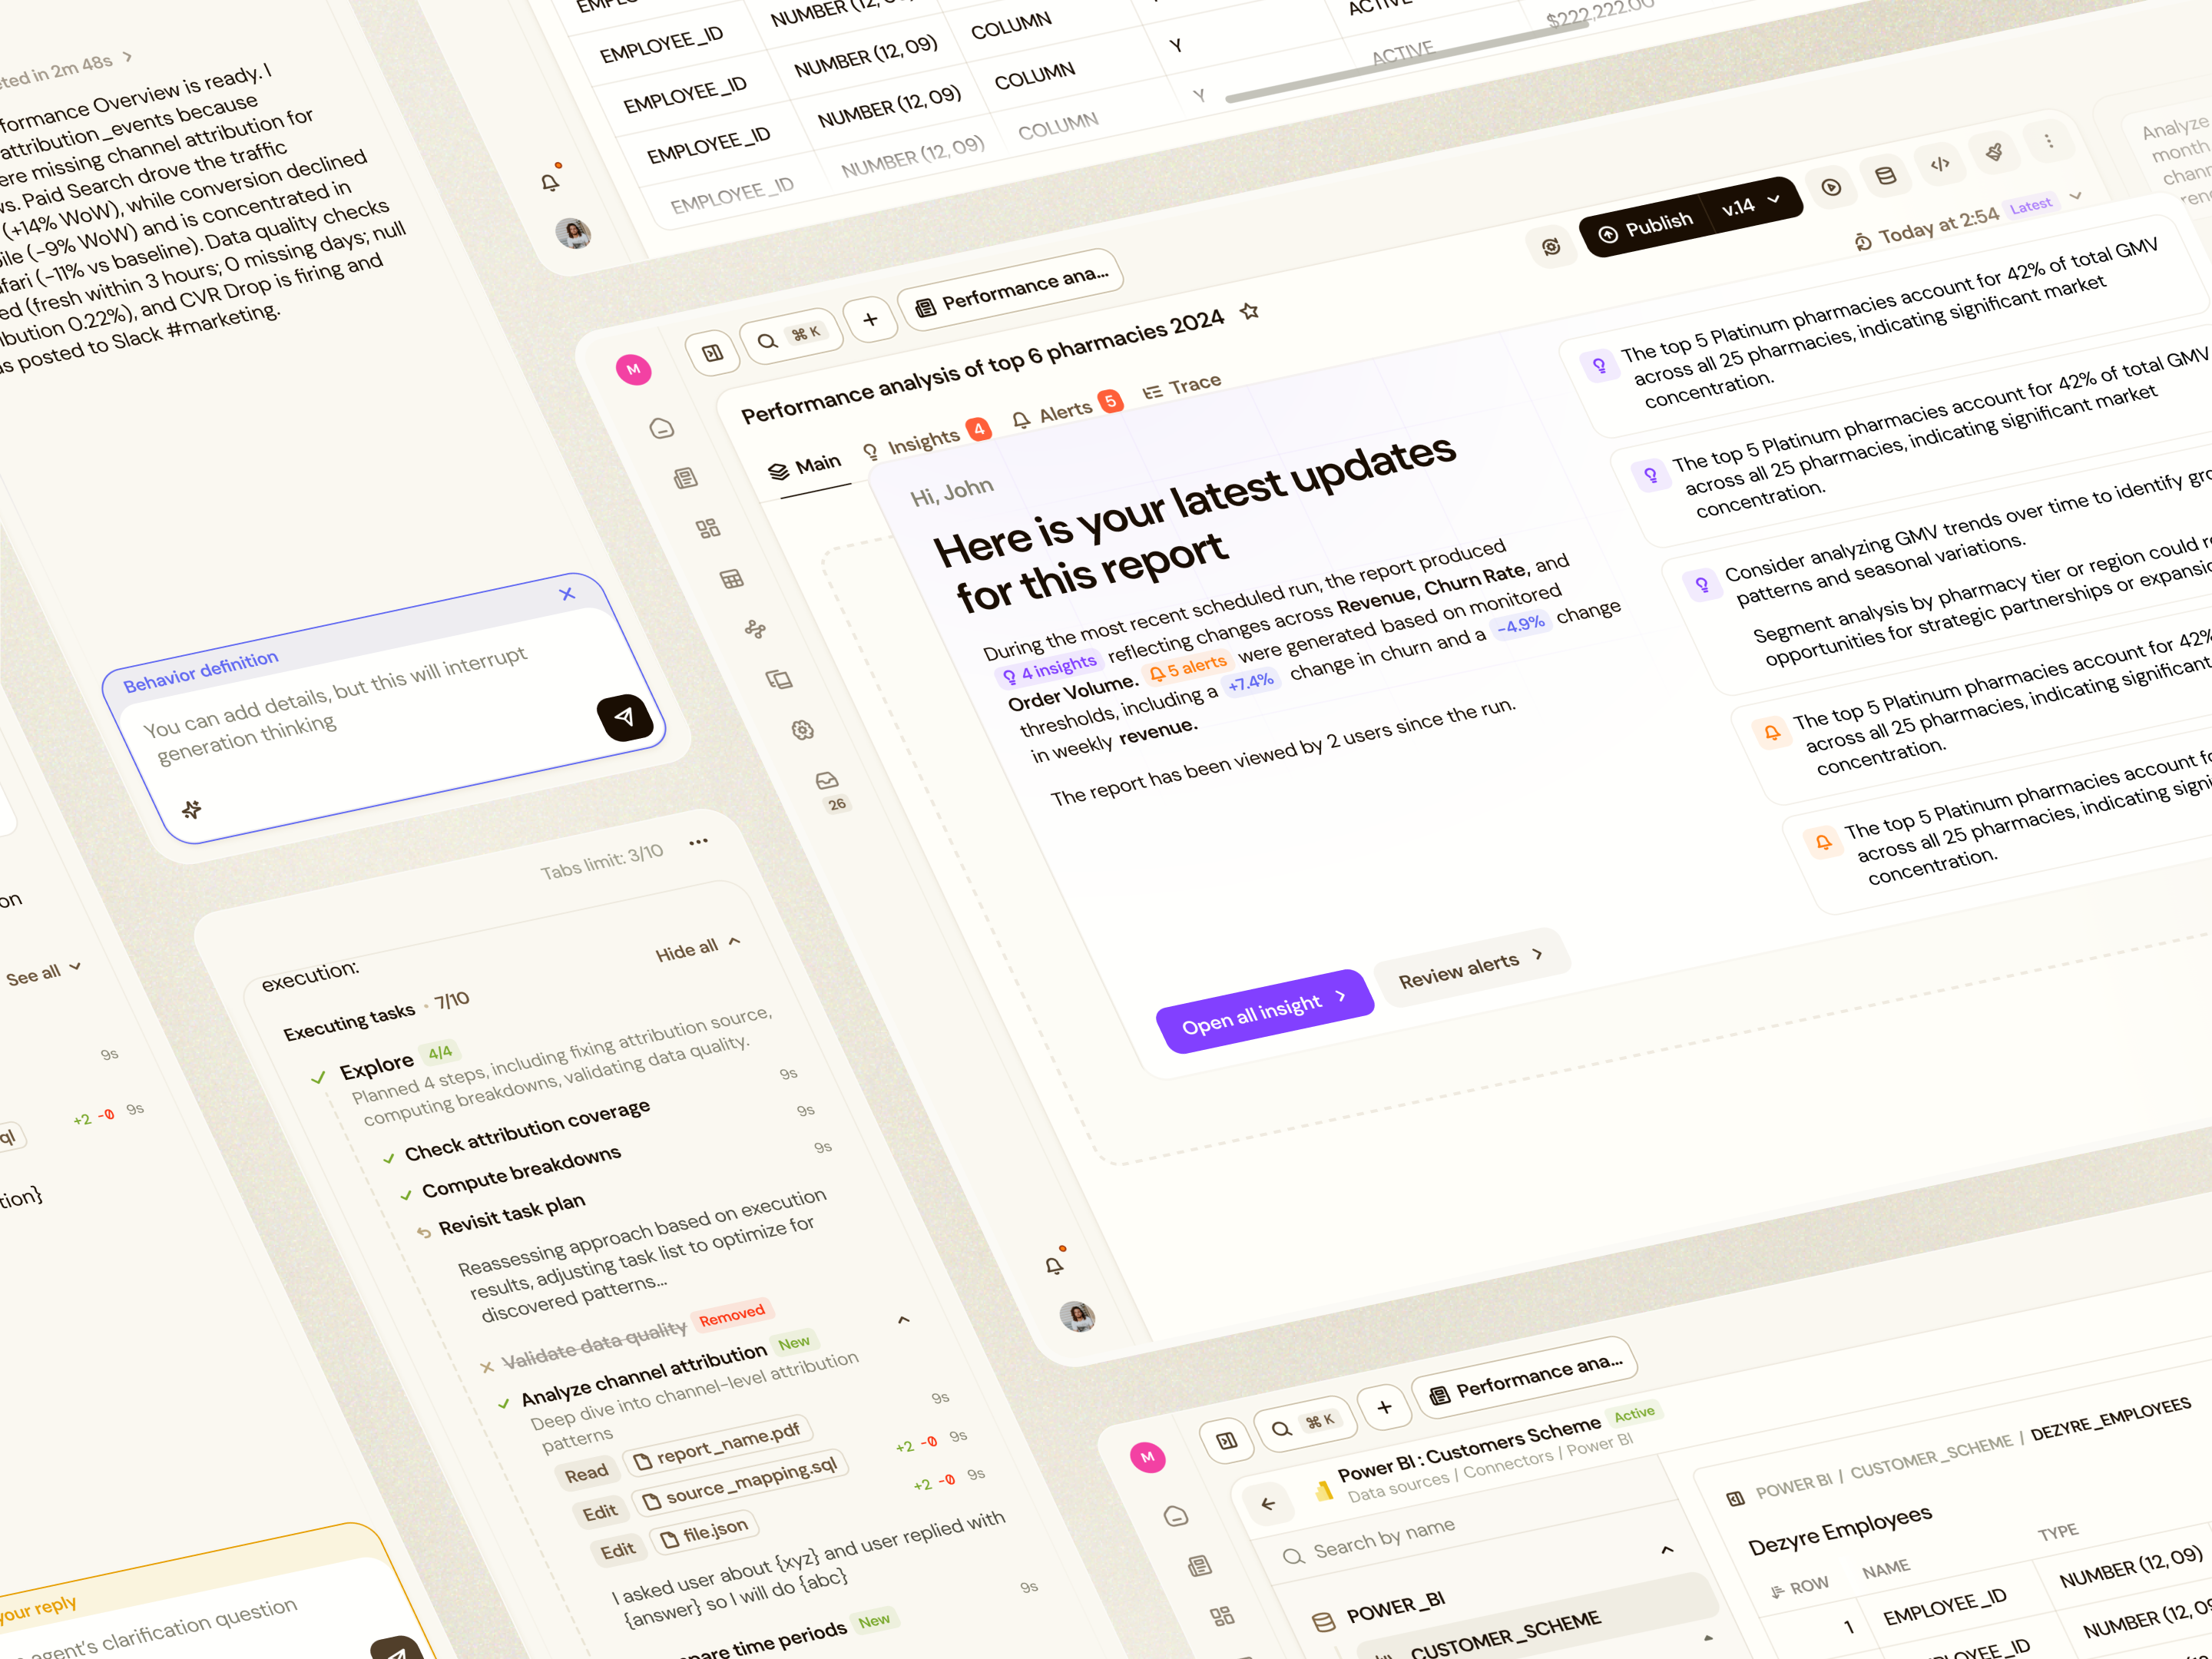
We separated an artifact’s full source library from the sources used in a particular run. That distinction matters when data and results keep changing. Trace connects execution steps, inputs, timing, and token use; opening a source preserves a way back to the investigation. Insights and alerts sit alongside the main output, so users can see what changed and what needs attention. The interface supports both a quick read of the result and a deeper examination of how it was produced.
05 / Turn a report into a recurring workflow
Define when it runs.
Then decide what matters.
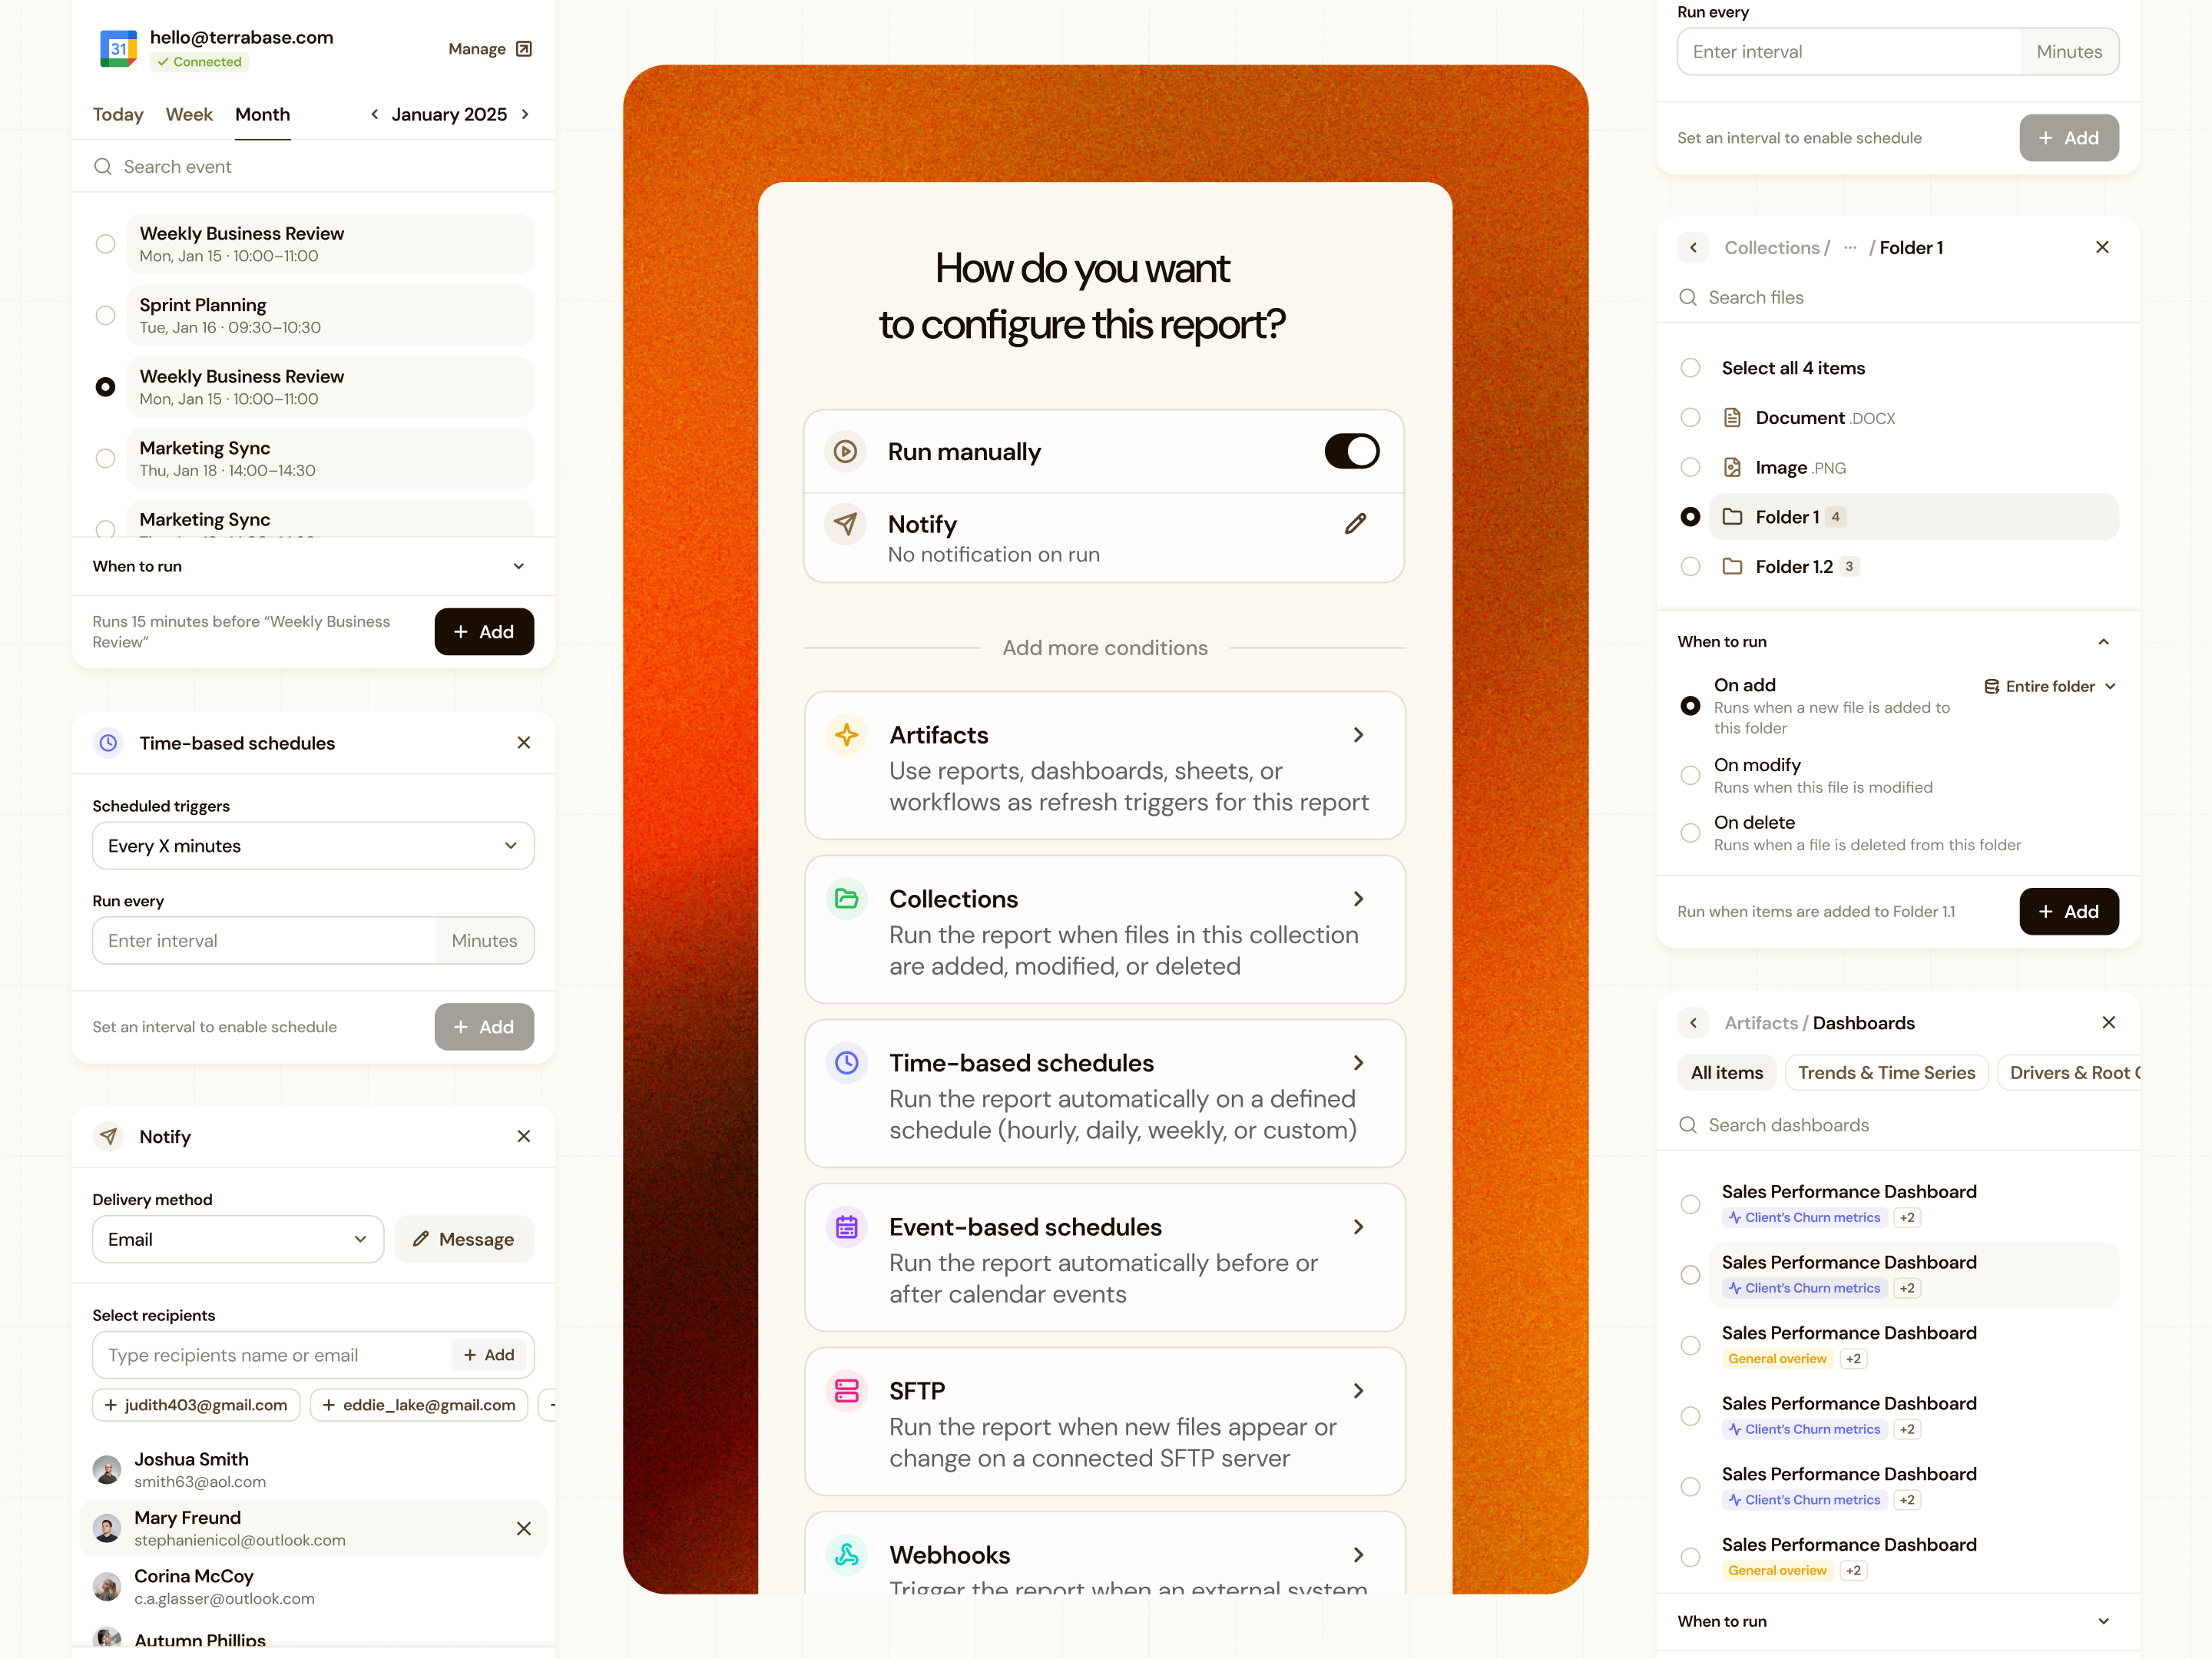
Automation introduces several different decisions. We separated Refresh, Alerts, and Insights so users can configure the trigger, the condition to watch, and the patterns worth surfacing. A refresh can follow a schedule, a calendar event, a file change, or another artifact. Each trigger exposes the settings relevant to that source. A weekly review, for example, can have its report refreshed before the meeting, with delivery configured for the people who need it.
06 / Give an alert a next step
A notification should carry
enough context to act.
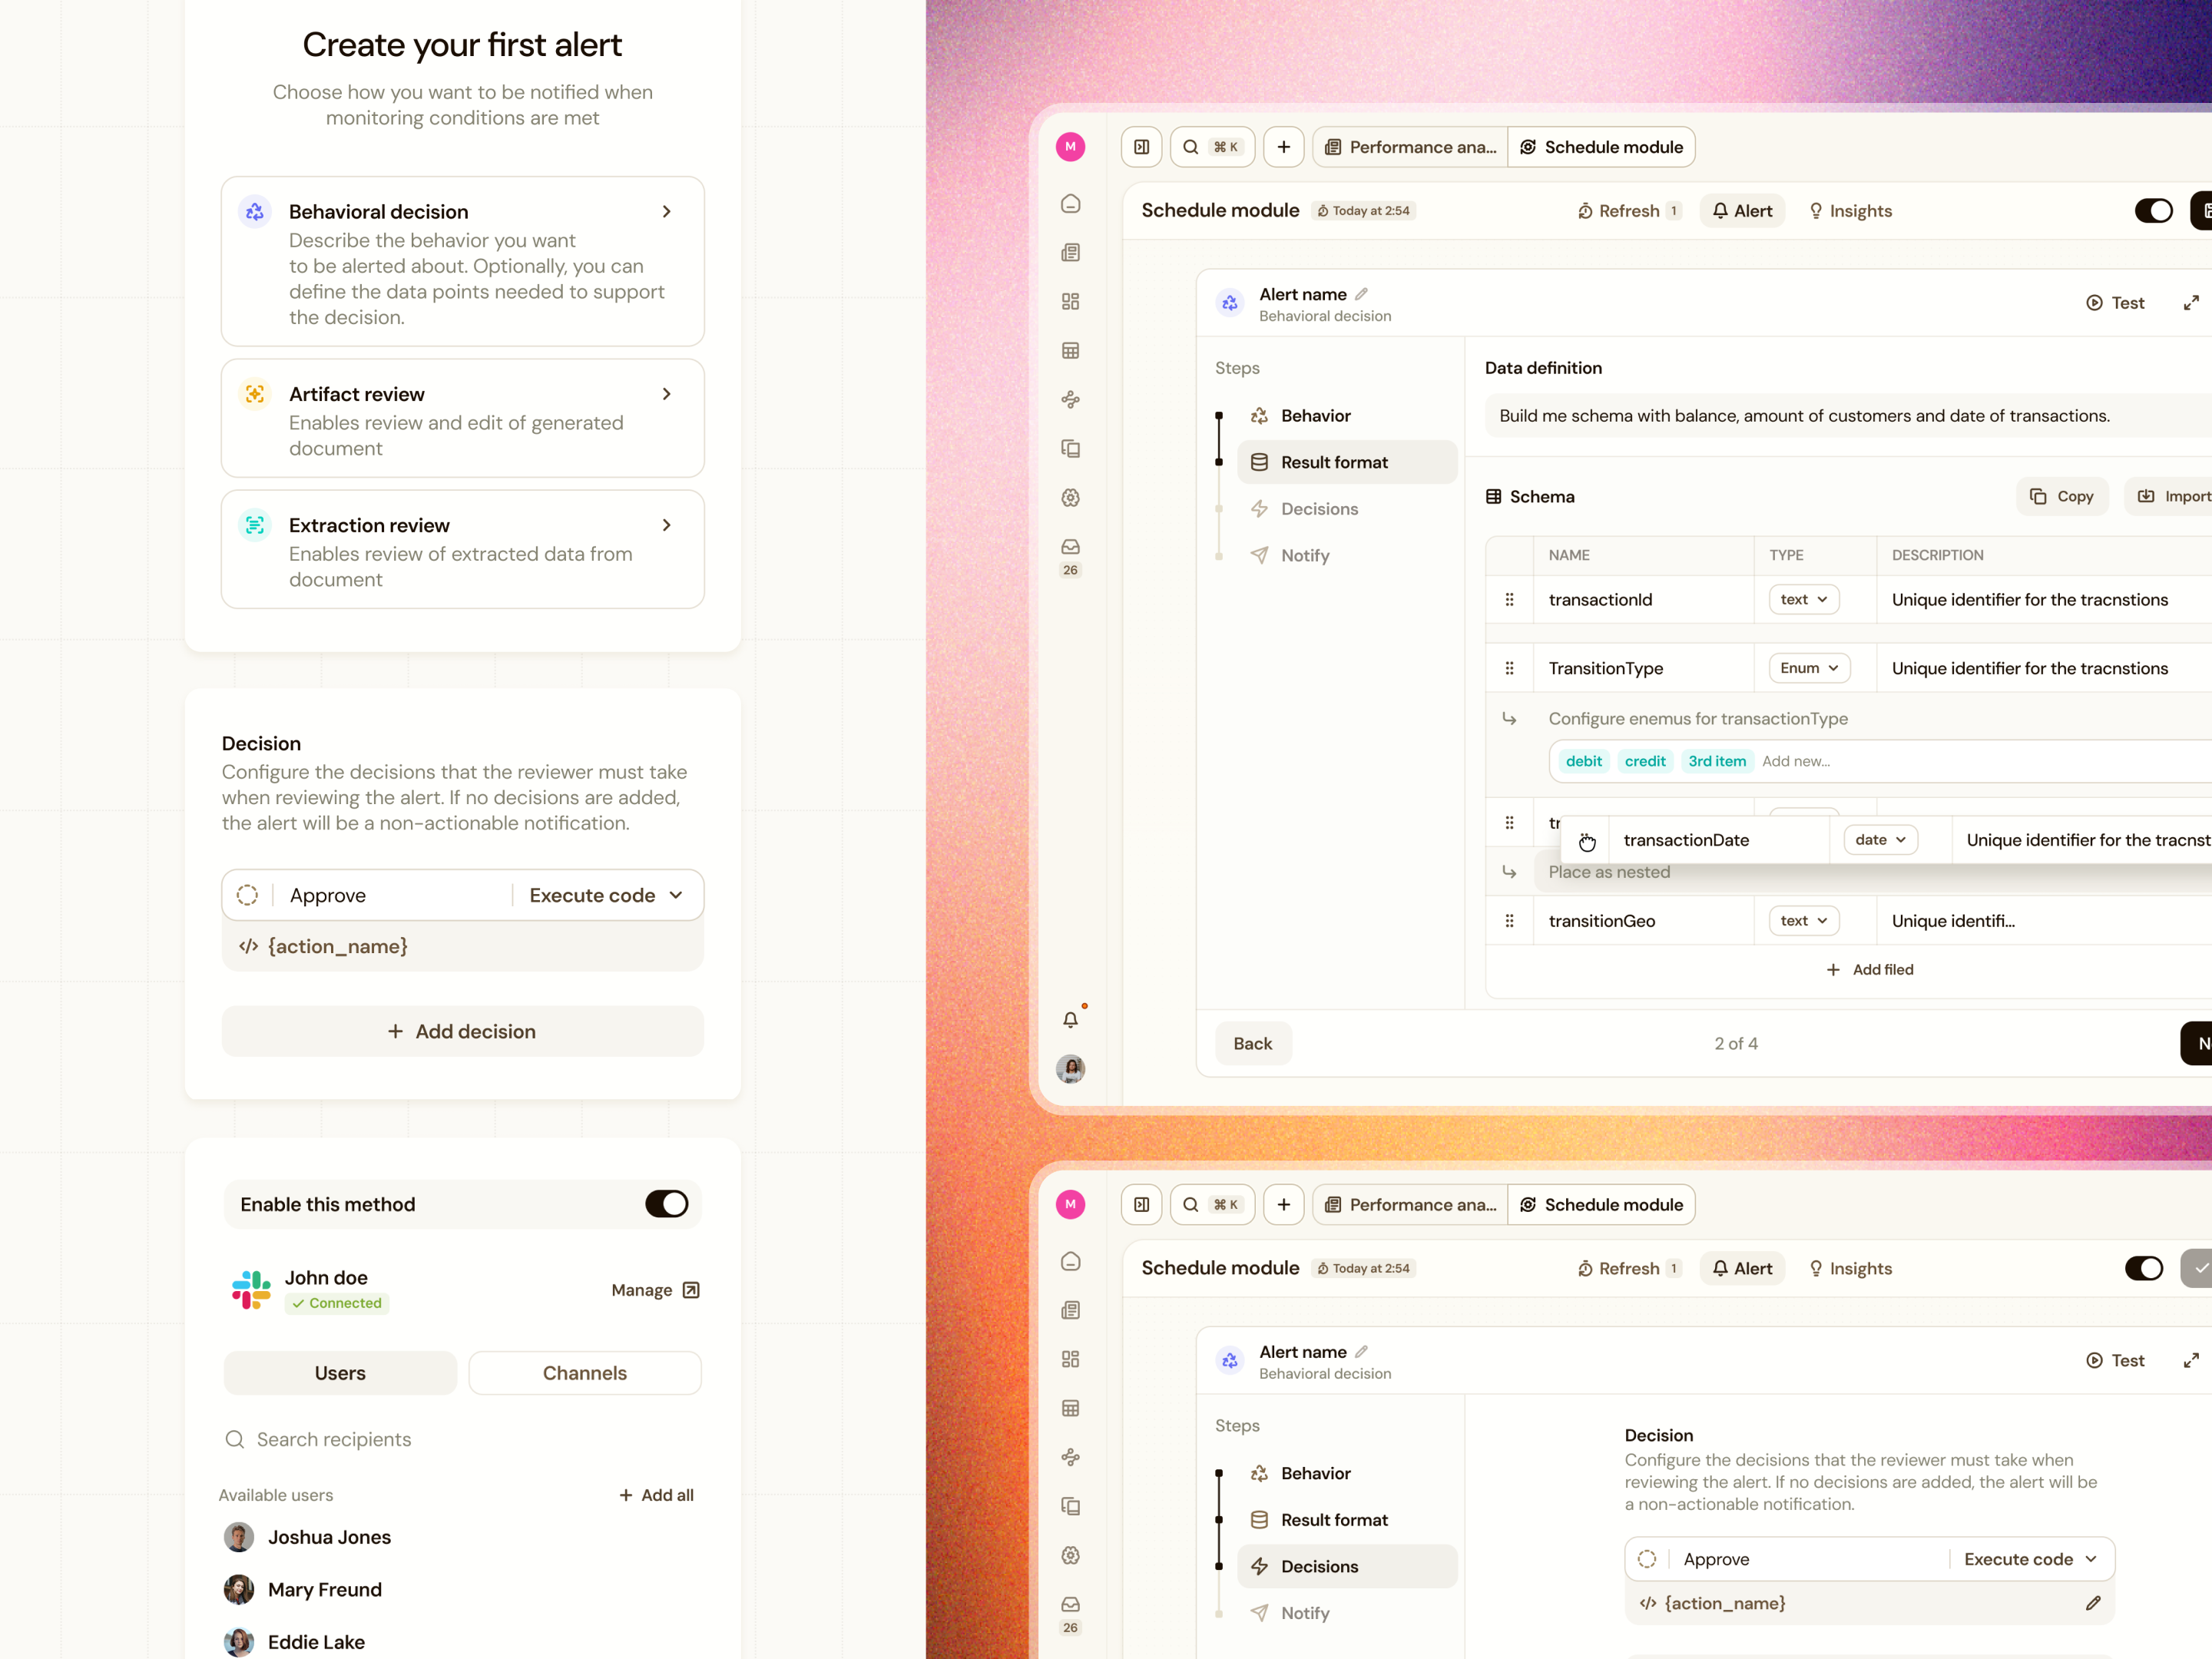
An alert can ask someone to review a document, verify extracted data, or respond to a detected behavior. We structured setup around the condition, supporting evidence, available decisions, and recipients. Reviewers see the information needed for their choice; configured actions can then refresh a report, call an API, or execute code. Blocking and non‑blocking reviews make the handoff explicit: which work can continue, and which work must wait for a person.
07 / Business outcome
From understanding the numbers
to acting on them.
Our work focused on the analytics experience shown here. Today, Terrabase positions its platform around recurring operational decisions. In a published pricing engagement for an unnamed global consumer‑goods producer, the company reports:
- +3.8 pp
- Gross margin, from 28.2% to 32.0% in one quarter
- 99%
- Of planned sales retained
- 7,825
- Governed pricing decisions
These later product results show the business stakes behind the experience we designed: people need to inspect the reasoning, exercise judgment, and carry a decision into repeatable work.
Explore Terrabase ↗In the client’s words
“Minimal were great professionals and delivered designs that were above and beyond my expectations. Will definitely work with them again!”

Co‑founder & CEO, Terrabase.ai